Using the FUtracer is fairly straight forward. During calibration you have already experienced many of the basics of using the GUI. I’ll cover a few basic tests, and a couple things not mentioned previously. NOTE: You must choose a theme from the Options before actually running tests.
Heater Hold
Heater Hold tells the GUI not to release the heater status after running a test. This wouldn’t be 100% necessary, except that the GUI is compatible with another tracer that uses an (mediocre) internal heater supply. The benefit here is that you can run a series of tests on the same tubes with different variables, and not have to wait for heater delays, or hit “Start” extra times. Since we’re using a separate heater PSU, the GUI has no affect on the heater supply anyway. Now that that’s out of the way, let’s run a few tests.
The Heater PSU
I’ve been using the U5618 PSU for tube heaters for years, and the only problems I ever had were my own fault. Pro tip: If you heat a 20V heater, make sure you set it back to 6.30V before testing any other tubes. Click the link above for instructions, that also shows you how to set presets in the PSU to quickly switch between different settings.
The heater PSU screen:

In the above image, the first numbers after SET are the Voltage (5.00) followed by MAX Current (5.100). For most tubes you will want to set this to 6.30V, you can set the current limit as you see fit. You must turn on the PSU by hitting the ON/OFF button, which will make the power button on screen green (as pictured). Allow your tube to warm up at your discretion before proceeding. I like to give the tube some time after the current draw (yellow numbers) settle down.
Tube Curve Tracing
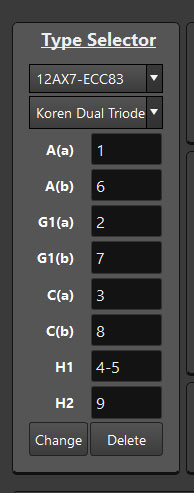
First you will need to choose your tube type from the Type Selector dropdown box.
Modeling
If you’re wondering whether or not you want to run your tests with modeling, modeling is required for: Anode Resistance, Transconductance (gm), and Amplification Factor (mu). If you’re not looking at those values, and prefer a faster sweep, then select Do Not Model. If you’re using modeling, be aware that some model types (i.e. pentodes) may run through 50% of the sweep progress before results start to show on the other tabs.
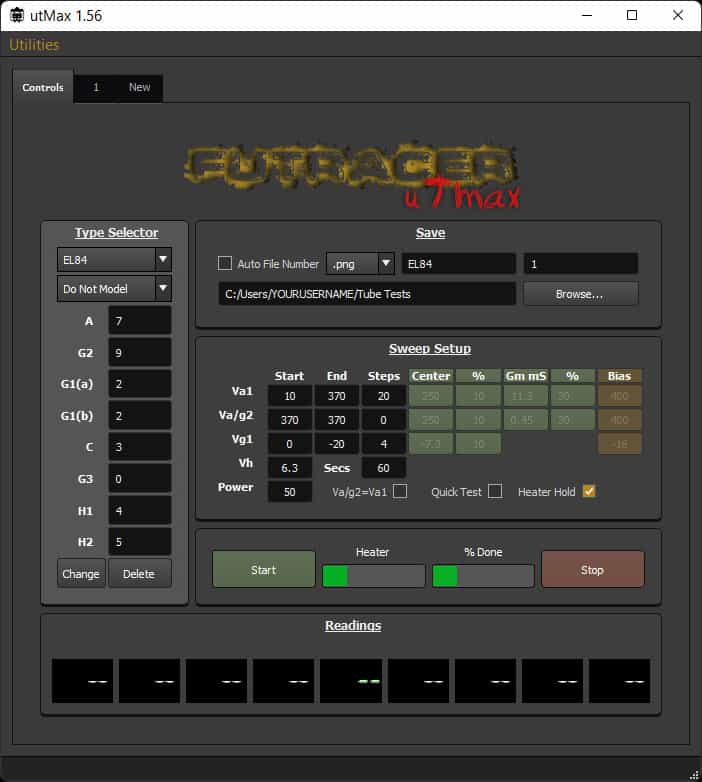
Sweep Setup
After selecting your tube from the Type Selector dropdown, review the Sweep Setup. Are you content with the amount of Steps? Do you want to use modeling? Is the Vg1 grid voltage range good, or do you need to sweep something specific? Make sure all variables fit your needs, then proceed with testing. At this point I also like to click the Heater Hold checkbox, as I rarely only run one test.
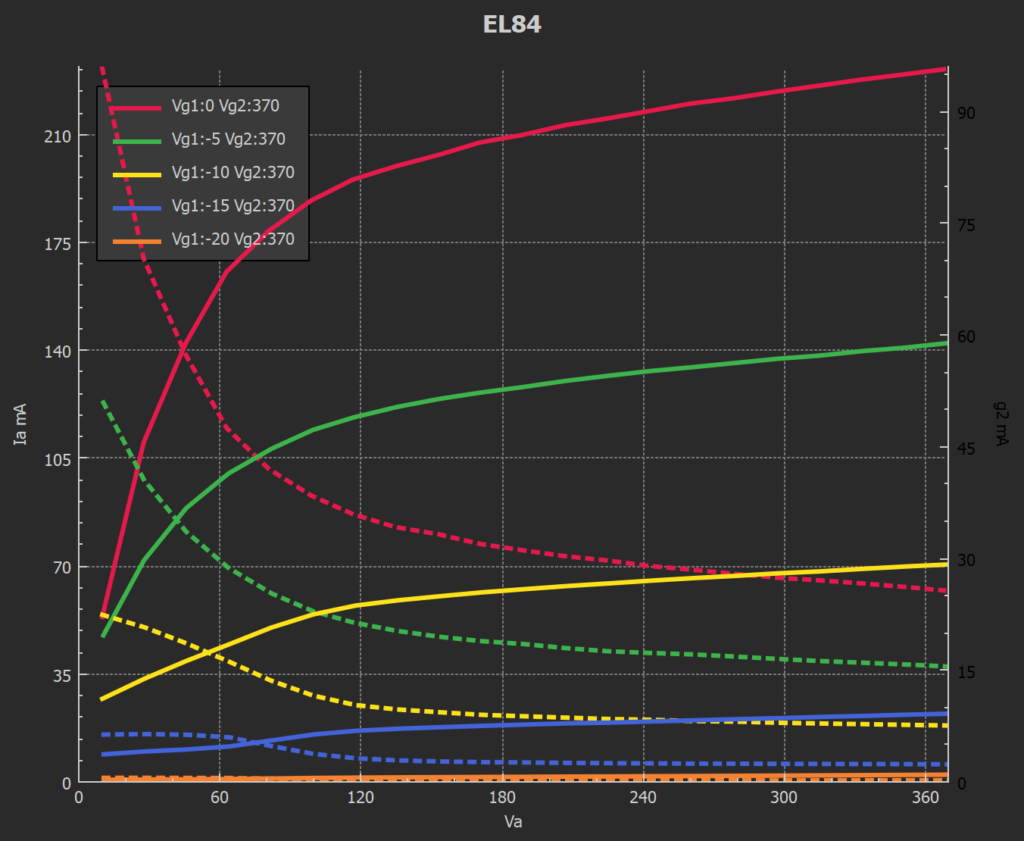
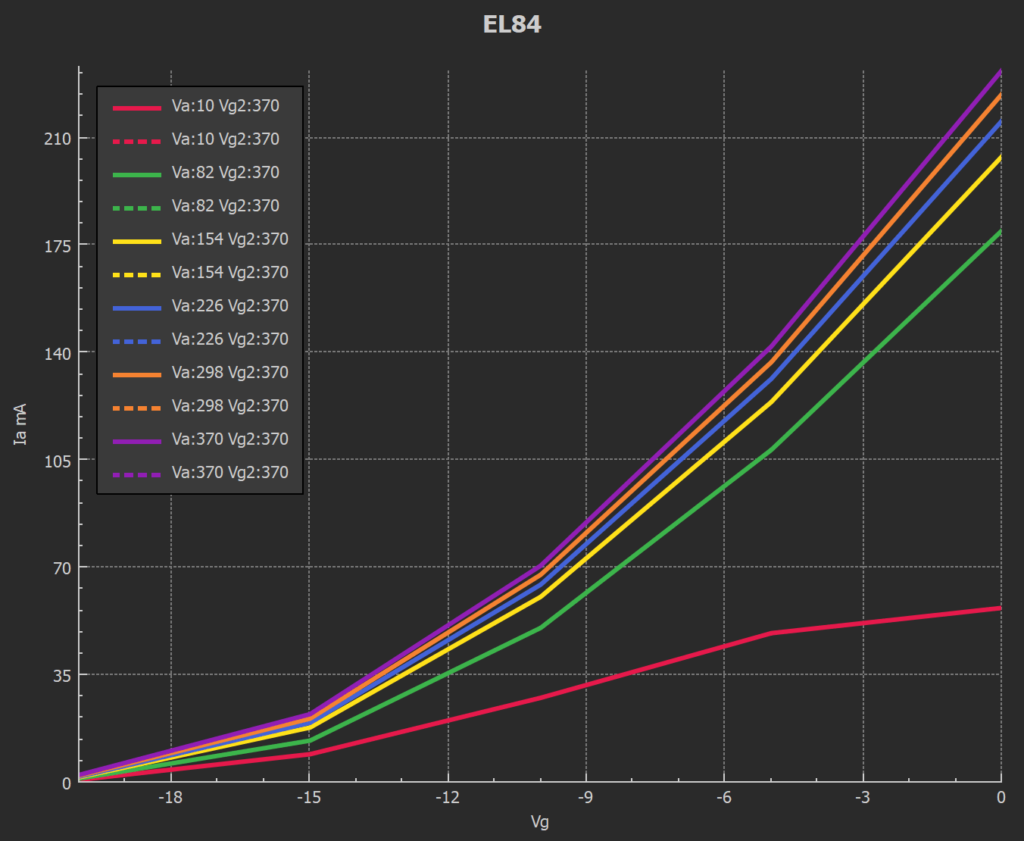
This is a standard pentode test on an EL84 tube. In the plot on the right, the solid line is Va (voltage anode), and the dashed line is Vg2 (voltage grid 2 – aka screen grid voltage).
The following test has Va/g2 = Va1 checked. This means that the test will sweep the screen grid voltage at the same values as the anode voltage. This is optional for pentodes, but required for dual triodes. Though I do have equal values entered in the common dual triodes to avoid confusion (if dual triodes are not running equal values in the sweeps, the results will look confusing). Modeling should also set the values equal for dual triodes.

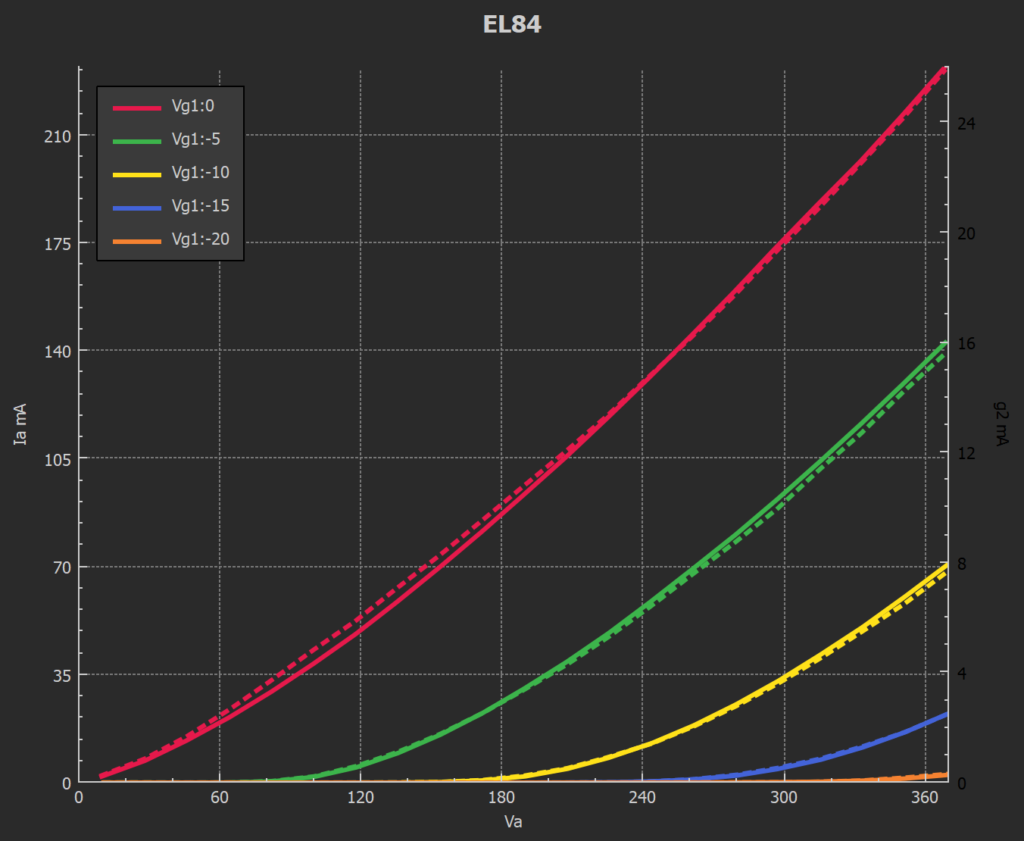
Alternate Plots and Plot Setup
The first image below has the plot change from Va (voltage anode) to Vg (voltage grid) relative to Ia (anode current). The second image shows the plot option dropdown for the dashed line. The options for the solid line are essentially the same, but currently cannot be shut off.

Quick Tests
If you want to see the most commonly sought values for a tube, you can perform a Quick Test and see how a tube responds. Refer to that tube’s datasheet, and you can usually see if the tube is within spec or not.
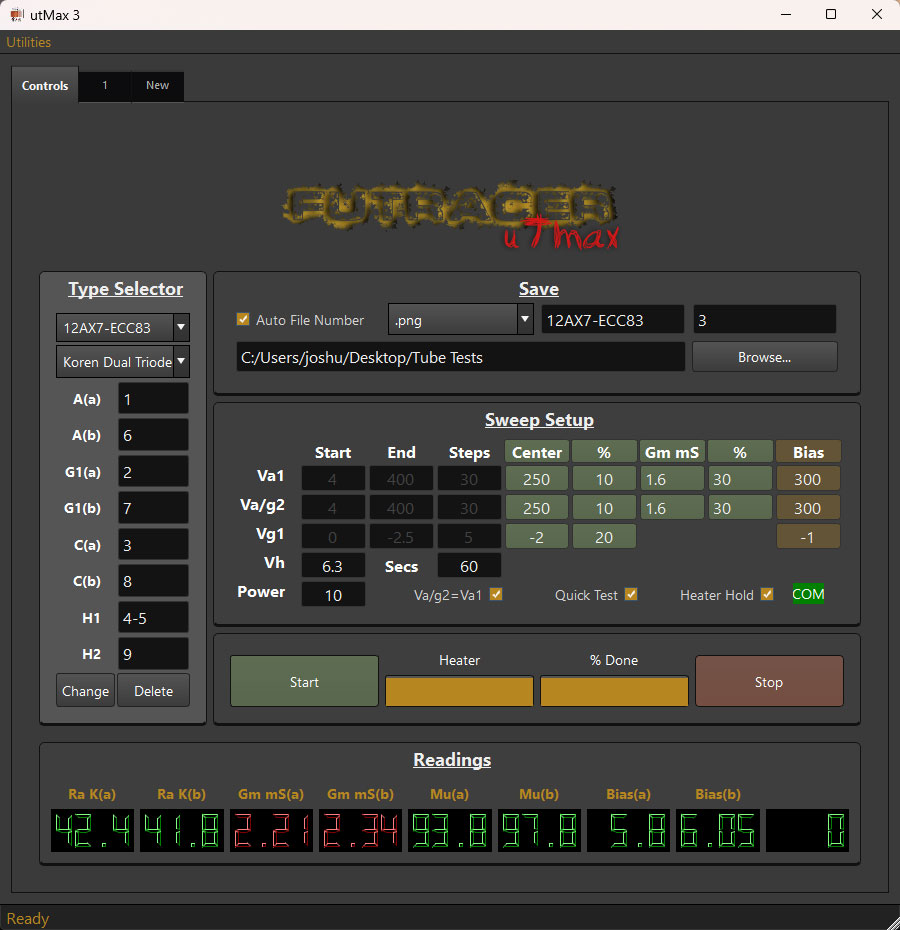
You can see in the Quick Test image above that when switching to the Quick Test, the normal sweep boxes become inactive, and the input boxes on the right become active. If you have target voltages you wish to test, you can enter them in there and perform the Quick Test.
The Status Bar
In the bottom of the image above, you can see the status bar says “Ready.” All status messages will display there including sweep progress, “Ping OK” etc.
Detailed Data
For any of the tests you run, you can save the data in an external file with the exact measurements shown on the plot. Below is an example of an EL84 using the Koren Pentode model.
Auto-Saving Data & Plots
If you’d like to auto-save your tube data and plots, it’s pretty straight forward. Select the checkbox (shown below) that says “Auto File Name” in the Save box. Browse for the location you want to save them in, and select the folder. Choose the file format you wish to use, and then run your tests. For me, saving as jpg files does not work. It might work for you, but if it doesn’t, simply choose another format.

Current Limits
A word of caution: The KSA1156YS on paper says the limit is 500mA. In general, it’s probably a good idea to respect that. I very often test tubes with the current coming close to 600mA, and in small amounts, that’s usually fine.
Given the currently limited availability of the KSA1156YS, it might be a good idea to limit the current you’re testing. You can set the current limit, or adjust the maximum current range in the options dialog:
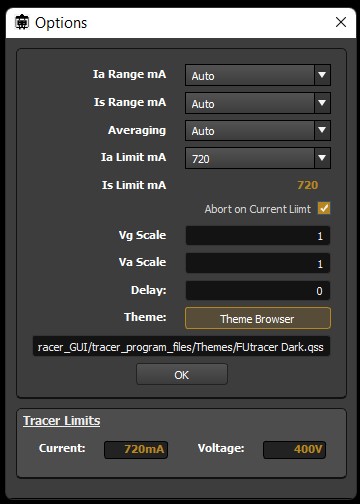

If you overdo the current for too long, the KSA1156 could potentially internally short, and you will likely see 0 current on your test results if that happens. You will also need to test the directly connected components. For example, if you short T12 (screen KSA), you will need to test T11 and T13 as well. This is likely a rare situation (if it ever happens), but you should be aware of it if you prefer to test higher current levels frequently.